Data-Driven Agronomy: What Data to Collect to Improve Crop Protection Decisions
Good crop protection decisions are rarely built on a single field walk, a weather forecast, or last year’s spray programme. They come from patterns. When those patterns are visible early enough, growers can act with more precision, lower waste, and stronger confidence.
That is the promise of data-led agronomy. Not more paperwork, not more dashboards for their own sake, but clearer signals about crop risk, crop timing, and the likely return from each intervention.
Better decisions start with better signals
Crop protection has always been a timing exercise. A fungicide applied a few days too late can miss the disease window. An insecticide used before a pest threshold is reached may add cost without adding value. A biocontrol or pheromone programme can perform very well, but only when placed into the right field conditions and crop stage.
Data sharpens that timing. Soil readings show whether the crop is already under stress. Weather data indicates whether infection conditions are likely. Trap counts and scouting reports show whether a pest population is building or fading. Phenology records tell you whether the crop is approaching a vulnerable stage.
When these signals are brought together, crop protection becomes less reactive and more disciplined.
The data sets that matter most
A useful dataset for crop protection does not need to be huge. It does need to be relevant, reliable, and linked to decisions. The table below shows the core categories that usually bring the highest value.
| Data type | What it tells you | Typical collection method | Decision it improves |
|---|---|---|---|
| Soil moisture | Rootzone stress, irrigation need, plant vulnerability | In-field probes, handheld checks | Irrigation timing, stress reduction, spray efficacy planning |
| Soil temperature | Pest development, emergence speed, microbial activity | Soil sensors | Early pest risk, planting and treatment timing |
| Nutrients, pH, salinity | Crop vigour, nutrient imbalance, susceptibility to stress | Soil analysis, tissue tests | Nutrition correction, plant resilience |
| Air temperature | Pest life cycle speed, disease development, heat stress | On-farm weather stations, local networks | Forecasting, treatment timing |
| Rainfall and humidity | Infection pressure, canopy wetness, wash-off risk | Weather stations, forecast models | Fungicide timing, re-entry planning |
| Leaf wetness or canopy microclimate | Local disease conditions in dense canopies | Canopy sensors, orchard or vineyard stations | Disease alerts, targeted applications |
| Crop phenology | The exact growth stage of the crop | Field notes, mobile apps, crop models | Protecting flowering, fruit set, grain fill |
| Pest and disease observations | Direct evidence of current threat | Smart traps, pheromone traps, scouting, lab checks | Threshold-based action, block prioritisation |
| Imagery and vegetation indices | Stress hotspots, uneven growth, hidden canopy issues | Satellite, drone, tractor-mounted cameras | Site-specific scouting, variable-rate action |
| Application and yield history | What worked, where pressure repeats, economic return | Farm records, software platforms | Programme design, budget control |
The strongest starting point for most farms is a combination of five streams: weather, soil moisture, crop stage, pest observations, and field history. That set alone can transform crop protection decisions.
More data can add value, though only when it answers a clear agronomic question. A thermal image is useful if it helps identify stress before symptoms are obvious. A high-frequency sensor feed is useful if someone is ready to act on it. Data that sits unused is only digital clutter.
This is why disciplined collection matters more than collecting everything.
Priority shifts by crop and region
The best dataset for a wheat grower in a temperate region is not the same as the best dataset for a protected vegetable grower, a vineyard manager, or a tropical fruit producer.
In broadacre cereals, soil moisture, nitrogen status, temperature patterns, and field history often sit near the top of the list. The crop may cover large areas, so regional weather and wide-area imagery can be highly useful. Pest counts matter too, though often at lower spatial intensity than in high-value horticulture.
High-value fruit and vine crops usually need more local detail.
Humidity, canopy temperature, leaf wetness, and trap-based pest monitoring are often central because orchard and vineyard microclimates can shift sharply within short distances. Crop stage also becomes critical, especially around flowering, fruit set, and pre-harvest intervals where protection timing can influence both yield and marketability.
Vegetable systems tend to demand the fastest feedback. Short crop cycles, frequent irrigation, and rapid canopy change mean moisture, nutrition, scouting, and imagery need to be reviewed far more often. A missed signal in a fast-moving crop can close the intervention window very quickly.
Regional climate changes the picture as well. In dry, irrigated zones, water-related data may dominate. In humid areas, disease-conducive weather can become the main driver. In tropical systems, year-round pest pressure often increases the importance of continuous monitoring and threshold tracking.
From observation to intervention
Collecting data is only useful if it changes what happens in the field. The strongest programmes turn measurements into a weekly or even daily decision rhythm. That means the agronomy team is not asking, “What data do we have?” but “What action does this week’s data support?”
A practical way to do this is to link each data stream to a specific question. Are conditions suitable for infection? Has the pest population crossed a threshold? Is the crop too stressed for a treatment to perform well? Is pressure uniform across the field, or concentrated in a few zones?
The best systems also respect timing across the season.
- Pre-season: soil analysis, field history, overwintering pest risk, drainage or salinity issues
- Establishment: emergence checks, early moisture patterns, first scouting rounds, baseline trap placement
- Rapid growth: canopy microclimate, disease risk periods, nutrition balance, imagery for stress hotspots
- Reproductive stages: flowering dates, fruit or pod protection windows, pest thresholds, spray interval discipline
- Pre-harvest: residue planning, late disease pressure, block prioritisation, quality protection
This sort of structure is especially valuable when using lower-residue and biologically based programmes. Semiochemical monitoring, mating disruption, repellent strategies, biocontrols, and biostimulant-led plant health approaches all benefit from timely, well-interpreted data. A rising trap trend, paired with suitable weather and a sensitive crop stage, gives a far better basis for action than any single signal on its own.
Tools that make data collection workable
The barrier to data-led agronomy used to be cost and complexity. That picture is changing. Sensors are more accessible, platforms are more usable, and remote imagery is available at a frequency that would have seemed unrealistic not long ago.
On-farm weather stations and soil probes remain among the highest-value tools because they generate local information rather than regional averages. That matters in crop protection. Disease and pest pressure can be driven by microclimate, and the nearest public weather point may not reflect what is happening in the field or canopy.
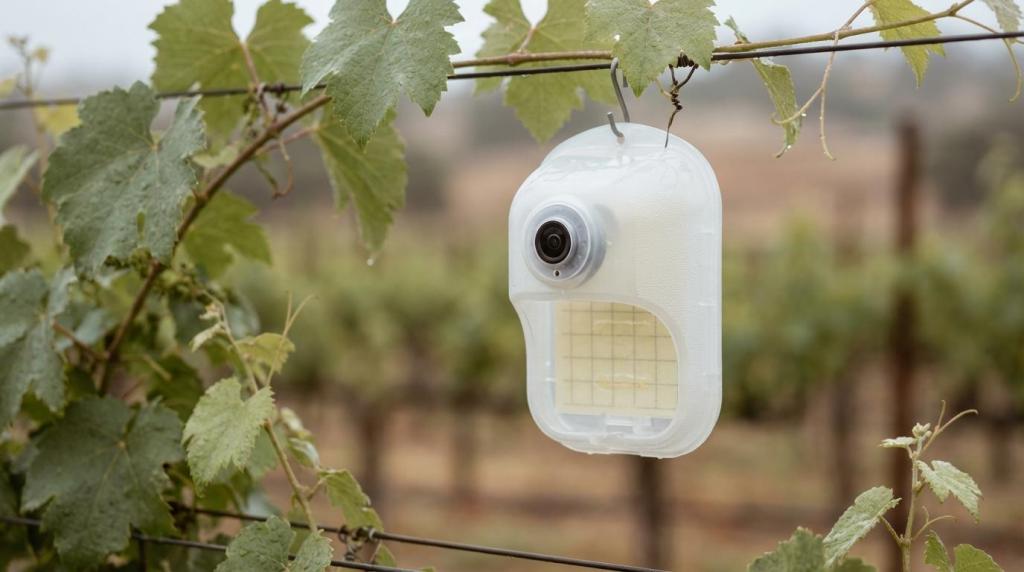
Smart trapping is another major step forward. Pheromone traps and other species-specific monitoring tools have long been central to integrated pest management. When those systems are paired with image capture, automated counting, or AI-assisted identification, the value rises sharply. Instead of waiting for a manual inspection round, growers can review trends quickly, compare blocks, and react sooner.
Satellite and drone imagery also have a strong place, though they work best as a guide rather than a diagnosis on their own. An image can reveal a stressed area. It cannot always tell you whether the cause is water, root damage, nutrition, disease, or pest feeding without ground truth. The real power comes when imagery directs scouting, and scouting confirms the cause.
Mobile apps and cloud platforms tie the pieces together. A simple field form for growth stage, symptom notes, trap catches, and treatment records often creates more value than a complicated system with poor adoption. Good agronomy platforms reduce friction. They make it easy to collect, compare, and review.
Integration matters more than volume
One of the biggest mistakes in data-led crop protection is assuming that more inputs automatically create better advice. In practice, poor integration can make decision-making worse. Conflicting timestamps, different field names, patchy calibration, and missing locations can undermine even a very well-funded setup.
The goal is not to create a mountain of information. The goal is to create one trusted operating picture for each field, block, or zone.
A few habits make a big difference here:
- One field naming system
- One map reference for each block
- One unit standard for temperature, rainfall, moisture, and rates
- Regular sensor calibration
- Clear ownership of data entry and review
- Automatic timestamps wherever possible
When datasets are harmonised, patterns start to stand out. A pest increase after a run of warm nights. A disease flare after extended humidity in a dense canopy. A repeated hotspot in the same part of the field across multiple seasons. That is where data stops being descriptive and starts being predictive.
This is also where decision support becomes more credible. A trap count on its own may suggest caution. A trap count linked with crop stage, temperature, humidity, and previous pressure history can support a much firmer intervention call.
A sensible place to begin
Many businesses do not need a full digital transformation to improve crop protection decisions this season. They need a focused first step. That may mean instrumenting a few representative fields rather than every hectare, or combining smart trap data with a local weather station before investing in wider sensing.
A strong starter package often looks like this: one reliable weather source, block-level crop stage recording, pest monitoring with regular trend review, soil moisture from key fields, and disciplined records of what was applied, where, and why. That is enough to improve timing and to build a stronger historical dataset for the next season.
There is also a commercial advantage in keeping the first phase practical. Teams are more likely to trust data systems when they can see a direct agronomic return. Better timing, fewer unnecessary passes, improved targeting, and stronger crop safety are tangible outcomes. Once those gains are visible, it becomes easier to add new layers, whether that is canopy sensing, AI-supported pest monitoring, or deeper integration with biological and semiochemical programmes.
The farms that gain most from data-led agronomy are rarely the ones with the most technology. They are the ones with the clearest questions, the best field discipline, and the confidence to act on what the data is saying.