How to Build a Pest Monitoring Program Using Traps and Thresholds
A strong pest monitoring programme does not begin with traps. It begins with a decision.
What do you need to know, how quickly do you need to know it, and what action will follow when the numbers change?
That shift in thinking is what separates routine trap checking from a proper decision-support system. Traps on their own can confirm activity, but they do not tell a grower what to do next unless they are tied to thresholds, field observations, crop stage, and a disciplined recording process. When those parts work together, monitoring becomes one of the most reliable ways to reduce uncertainty, sharpen timing, and cut unnecessary inputs.
Start with the decision, not the device
Many monitoring programmes fail because they begin with a shopping list of traps rather than a plan for action. A better approach is to define the target pest, the crop stage at risk, the area to be covered, and the trigger that will prompt a response.
In practical terms, that means deciding whether the programme is meant to do one of three jobs: early warning, timing of intervention, or measuring pressure through the season. A pheromone trap used to identify first flight is doing a different job from a sticky card used to show whether whitefly numbers are climbing across a protected crop.
It also means accepting that traps are only one sampling tool. A trap may show flight into a field, while plant inspections reveal whether eggs, larvae, feeding injury, or beneficial insects are also present. The best programmes combine both.
After defining the purpose, it helps to write a simple operating brief for the season.
- Target pest: one species or a clearly defined pest group
- Crop risk window: when the crop is vulnerable
- Action point: the threshold that changes management
- Check routine: who inspects, when, and how often
- Record format: paper sheet, spreadsheet, app, or dashboard
Match the trap to the pest
Trap choice should reflect pest behaviour, not habit. If the pest flies to a species-specific scent, pheromone traps may be the right fit. If it responds strongly to colour, a sticky card is often more useful. If it is mainly active at night, light-based trapping may offer better visibility. Ground-active pests need pitfall or refuge methods rather than aerial traps.
The table below gives a practical starting point.
| Trap type | Best used for | What it tells you well | Main limitation |
|---|---|---|---|
| Pheromone trap | Species-specific moths and other lure-responsive pests | Presence, flight timing, peaks in activity | Usually catches only one sex or one species |
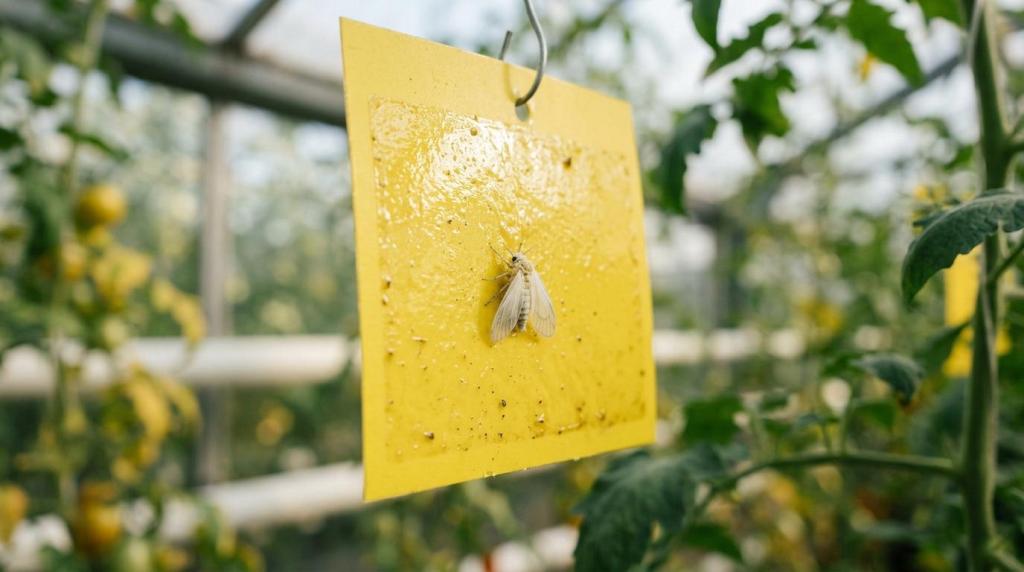
| Sticky trap | Thrips, whiteflies, aphids, leafminers, fungus gnats | Broad activity trends across a crop | Lower selectivity, more non-target catch |
| Light trap | Nocturnal flying insects | Night-flight presence and seasonal movement | Can catch many non-pest insects |
| Pitfall trap | Crawling soil and surface pests | Ground activity and relative abundance | Strongly affected by local microhabitat |
| Refuge or shelter trap | Slugs, earwigs, nocturnal shelter-seeking pests | Daytime aggregation under cover | Less useful for mobile flying pests |
A programme can use more than one trap type, though each should have a clear role. Mixing methods can widen coverage, yet it also raises the standard required for identification, servicing, and data handling. A yellow sticky card full of mixed insects should never be interpreted in the same way as a species-specific pheromone trap.
For science-led crop protection programmes, semiochemical lures are often the most precise starting point because they give earlier and cleaner signals than broad-spectrum trapping alone.
Placement is where accuracy is won or lost
Even a good trap gives poor information if it is in the wrong place. Placement should reflect how the pest moves through the crop, where it enters the block, and the height at which it flies or shelters.
In broad-acre crops, traps often sit just above the canopy and move upward as the crop grows. In orchards or vineyards, monitoring traps are usually placed within the canopy rather than only on the boundary. In protected cropping, cards are commonly positioned among the crop and near likely entry points, with a consistent layout that can be mapped and repeated.
The principle is simple: put the trap where the pest is active, not where the trap is easy to reach.
A practical layout normally includes:
- mixed edge and interior coverage
- enough spacing to avoid interference between lures
- consistent trap height across the site
- clear labelling and fixed trap IDs
- easy but protected access for inspection
Density also matters. Too few traps can hide hotspots. Too many can create noise without adding useful resolution. Published guidance for individual pests should always take priority, though a sensible baseline is to begin with representative coverage across management zones rather than treating the whole farm as one uniform block.
Thresholds turn counts into action
Trap catches become valuable when they are linked to thresholds. Without thresholds, monitoring can drift into passive record keeping.
There are two threshold ideas worth keeping distinct. The economic injury level is the point at which pest damage equals the cost of control. The action threshold sits below that level and marks the point where action should begin, giving enough time to stop the pest before losses pass the economic line.
In everyday farm use, the action threshold is the one that shapes decisions.
Some thresholds are based directly on trap counts. Others combine trap counts with crop stage, plant inspections, or weather-driven development models. A moth catch that means little before a vulnerable stage may become highly relevant a week later. The same number can imply different risk depending on whether the crop is establishing, flowering, filling, or nearing harvest.
Where published local thresholds exist, use them. Where they do not, build provisional thresholds from farm history, adviser input, and observed damage, then refine them over time.
- Trap threshold: catch per trap per day or per week
- Field threshold: infestation level on plants or percentage damage
- Timing threshold: first sustained catch that starts a degree-day model
- Economic threshold: the point where intervention is financially justified
Build a checking rhythm that the whole team can keep
Consistency often matters more than intensity. A trap checked irregularly gives weak trend data, even if the trap itself is suitable.
Most programmes work well with one or two checks each week during the main risk period, plus a fixed routine for lure replacement, sticky insert renewal, and record entry. High-pressure periods may justify more frequent checks, especially where fast-moving pests or short market windows leave little room for delay.
It helps to standardise the inspection day, the counting method, and the way results are written down. If one scout records total catch and another records only new catch since the previous visit, the numbers will be hard to compare.
A reliable inspection record should include more than the insect count. Weather, irrigation events, crop stage, nearby disturbance, and treatment history all help explain sudden changes in trap activity. A spike after warm still nights may be highly meaningful. A drop during rain and strong wind may not reflect a real fall in pest pressure.
Record trends, not just snapshots
A single catch tells you presence. A sequence of catches tells you population direction.
That is why graphing trap data is so useful. Even a basic line chart by date and trap ID can show first flight, rising pressure, peak activity, and the effect of intervention. Over a season, these patterns become far more useful than memory.
This is also where digital agronomy support can add real value. When trap counts sit alongside weather, crop stage, and treatment timing, the programme starts to answer better questions. Are catches rising earlier than last year? Is pressure concentrated in one block? Did a control measure reduce catches in the following check interval?
Keep the records simple enough to maintain, but rich enough to guide the next decision.
A practical workflow for the season
Most successful programmes follow a repeatable sequence rather than improvising from week to week.
- Define the target pest and risk period.
- Select the trap type and lure suited to that pest.
- Set trap density, layout, and check interval.
- Install traps before expected pest arrival.
- Record counts with weather and crop-stage notes.
- Compare results against thresholds and field observations.
- Act only when the data justify it.
- Review results after intervention and refine the plan.
This kind of discipline is especially useful where growers are integrating semiochemicals, biological controls, biostimulant-based plant health programmes, or reduced-chemical strategies. Monitoring keeps those approaches precise. It shows when early action is justified and when restraint is the better choice.
Common weaknesses that quietly reduce programme value
A monitoring programme can look busy while still producing weak decisions. The usual causes are familiar: stale lures, overloaded sticky surfaces, poor identification, badly positioned traps, or thresholds copied from a different crop and climate without adjustment.
Another common problem is treating all fields as if they behave alike. A sheltered block beside woodland, a greenhouse door line, and an exposed field margin may all carry different pressure. If the programme does not reflect those patterns, it will miss the very variation that matters most.
The following checks are worth revisiting during the season.
- Placement drift: traps fall below canopy or disappear into foliage
- Service gaps: lures expire, adhesives clog, trap bodies break
- Identification errors: non-targets counted as target pests
- Threshold drift: old action levels used despite changed crop value or crop stage
- Data lag: counts recorded late, after the best intervention window has passed
Putting the numbers to work
A well-built programme creates confidence because it replaces guesswork with evidence. It does not remove every uncertainty, yet it does make action more timely, more proportionate, and easier to justify.
That matters on farms aiming to protect yield and quality while reducing unnecessary applications. It matters in high-value crops where timing can shape margin. And it matters in programmes built around sustainable pest management, where semiochemicals, biological tools, and targeted intervention all depend on seeing pressure early and interpreting it correctly.
Traps show activity. Thresholds decide what that activity means. When both are planned properly, pest monitoring stops being a routine task and becomes one of the most useful management systems on the farm.